1. Cruise Information
Cruise ID: YK10-15
Name of vessel: YOKOSUKA
Title of the cruise: Southern Mariana Trough back-arc spreading system with three different hydrothermal activities, Part 2
Cruise period: 10-18/November/2010
Ports of call: Palau - Guam
Research area: Southern Mariana Trough
Participants:
Nobukazu Seama#,1,4,5, Toshinori Sato2, Tomoaki Yamada3, Mariko Mizuno2, Maho Kimura4, Haruka Shindo5 (Onboard Scientists)
Kyoko Okino6, Masanao Shinohara3, Yoshifumi Nogi7, Takeshi Tsuji8, Kimihiro Mochizuki3, Takehi Isse3, Yuki Shibata4, Tetsuo Matsuno1 (Scientists on land)
Satoshi Okada9, Masayuki Toizumi9, Morifumi Takaesu9, Hisanori Iwamoto9 (Marine Technician)
# Chief scientist/Representative of the science party
1 Research Center for Inland Seas, Kobe University, 2 Graduate School of Science, Chiba University, 3 Earthquake Research Institute, University of Tokyo, 4 Graduate School of Science, Kobe University, 5 Faculty of Science, Kobe University, 6 Atmosphere and Ocean Research Institute, University of Tokyo, 7 National Institute of Polar Research,8 Engineering Geology, Kyoto University, 9 Nippon Marine Enterprises, Ltd.
2. Overview of the Observation
We successfully recovered 10 OBEMs and 14 OBSs across the Southern Mariana Trough back-arc spreading system (Table 1). Observation started after the deployment of OBEMs and OBS during another Yokosuka cruise (YK10-10) in this August (Figure 1); the measurement of magnetic and electric field variations by OBEMs and seismic observation by OBSs at the ocean bottom. We also conduct seismic survey to investigate seismic velocity structure using 9 OBSs, an air-gun, and a single channel hydrophone streamer (Figure 2). Further, we conducted surface geophysical survey to collect multi-narrow beam bathymetry, magnetic field, and gravity field data after the instruments recovery, which cover total 340 miles in the survey area (Figure 3). These observed data will be used to provide geophysical constraint on geodynamics of the Southern Mariana Trough back-arc spreading system with three different hydrothermal activities. The observed data will be analyzed to derive upper mantle structure, crustal structure, hypocenter distribution, and tectonic history, which will provide important constraint on geodynamics of the Southern Mariana Trough back-arc spreading system with three different hydrothermal activities.
| Site | Location | ||||
| Latitude (N) | Longitude (E) | Depth (m) | |||
| Deg. | Min. | Deg. | Min. | ||
| EM1 | 13 | 19.25 | 143 | 02.81 | 3924 |
| S1 | 13 | 11.00 | 143 | 15.06 | 3746 |
| EM2 | 13 | 10.92 | 143 | 15.09 | 3750 |
| S2 | 13 | 06.72 | 143 | 21.49 | 3550 |
| EM3 | 13 | 06.69 | 143 | 21.56 | 3567 |
| S3 | 13 | 02.37 | 143 | 27.96 | 3268 |
| EM4 | 13 | 02.37 | 143 | 28.05 | 3254 |
| EM5 | 12 | 58.00 | 143 | 34.53 | 3086 |
| EM6 | 12 | 56.74 | 143 | 36.41 | 2868 |
| S6 | 12 | 57.19 | 143 | 38.92 | 3075 |
| S7 | 12 | 54.59 | 143 | 38.92 | 2985 |
| EM7 | 12 | 55.43 | 143 | 38.18 | 3123 |
| S8 | 12 | 53.46 | 143 | 41.27 | 3315 |
| EM8 | 12 | 53.47 | 143 | 41.21 | 3316 |
| S9 | 12 | 49.13 | 143 | 47.51 | 2585 |
| S10 | 12 | 45.05 | 143 | 54.01 | 3685 |
| EM10 | 12 | 45.09 | 143 | 53.96 | 3685 |
| EM11 | 12 | 40.82 | 144 | 00.47 | 3750 |
| S12 | 13 | 01.38 | 143 | 36.75 | 3073 |
| S13 | 12 | 59.06 | 143 | 40.16 | 3135 |
| S14 | 12 | 56.85 | 143 | 43.60 | 3164 |
| S15 | 12 | 54.69 | 143 | 32.19 | 3103 |
| S16 | 12 | 52.48 | 143 | 35.45 | 3084 |
| S17 | 12 | 50.19 | 143 | 39.01 | 3541 |
Table 1. Observation site locations of OBEMs and OBSs recovered
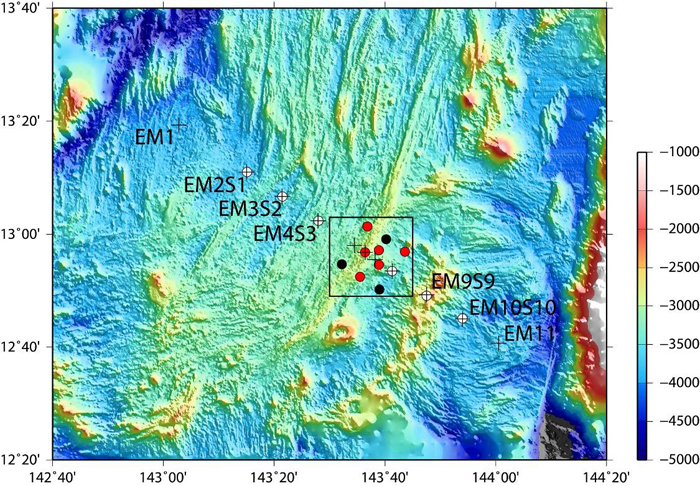
Figure 1a.
Location map of OBEM (crosses) and OBS (circles). Colors of circles show different types of OBSs (white, red, and black correspond to LTOBS_ERI, STOBS_ERI, and STOBS_Chiba types of OBSs, respectively). Location of Figure 1b is shown by square.
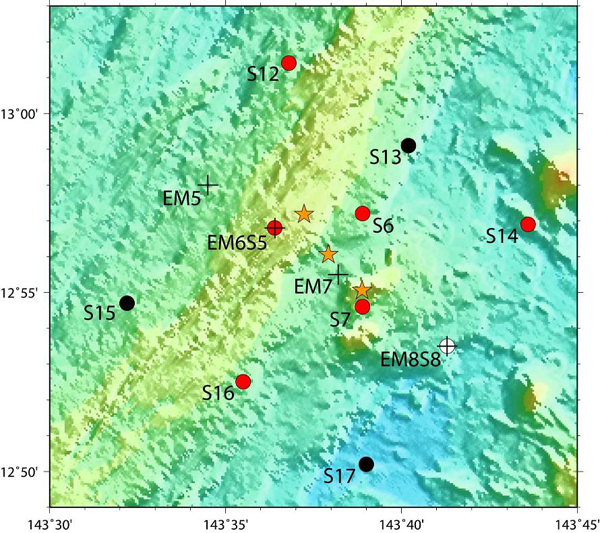
Figure 1b.
Location map of OBEM and OBS near the spreading center. Symbols are the same as Figure 1a. Three hydrothermal fields that extrude different water contents are also shown by orange stars.
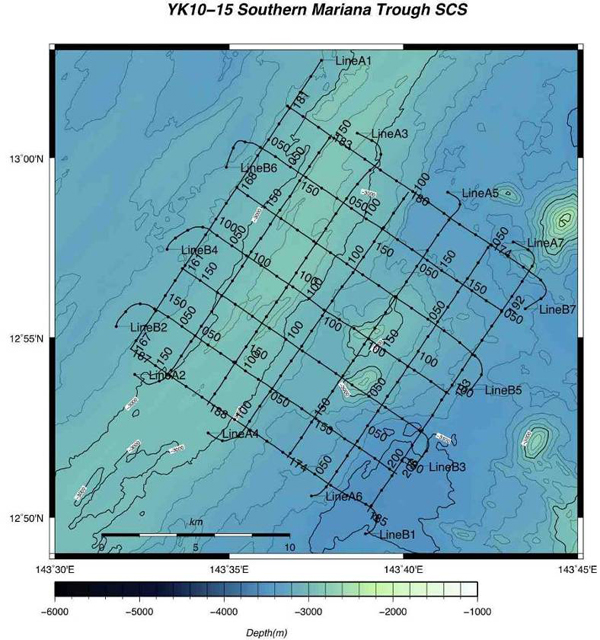
Figure 2.
Location map of seismic reflection and refraction survey line. The numbers denote air-gun shot numbers of each survey line. The area is the same as Figure 1b.
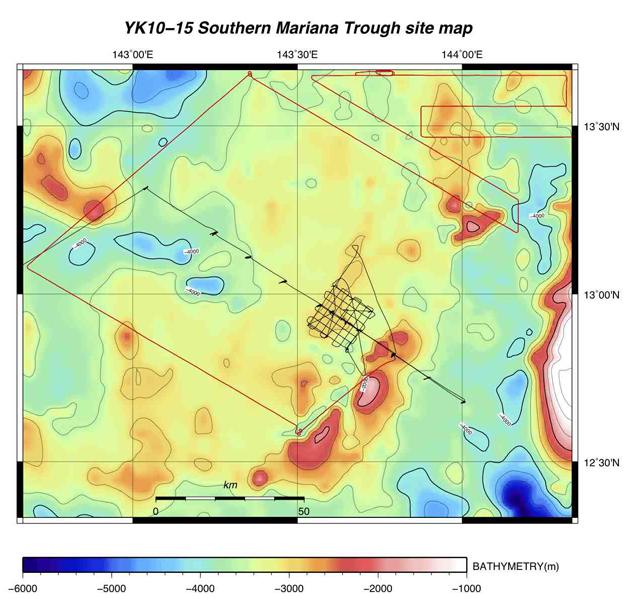
Figure 3.
Ship tracks (red and black lines) of the cruise in the survey area and red lines shows ship tracks for the surface geophysical survey
Acknowledgement
We gratefully recognize the efforts of the officers and crew (Satoshi Susami, captain) of the R/V Yokosuka during the cruise. We thank all the support staffs in JAMSTEC. This research was supported by the scientific program "TAIGA (Trans-crustal Advection and In-situ reaction of Global sub-seafloor Aquifer)" sponsored by the Ministry of Education, Culture, Sports, Science and Technology (MEXT), Japan.